Genetic analysis of human contour integration by the laboratories of Fang Fang and Yi Rao
On July 30th, 2019, a paper entitled “Heritability of human visual contour integration — an integrated genomic study” was published in European Journal of Human Genetics by the laboratories of Professors Fang Fang and Yi Rao at Peking-Tsinghua Center for Life Sciences and the PKU-IDG/McGovern Institute for Brain Research. This paper reports their investigations of the genetic basis of visual contour integration by using the genome-wide association analysis (GWAS) technique. Dr. Zijian Zhu and Dr. Biqing Chen from Yi Rao’s lab and Dr. Ren Na from Fang Fang’s lab are the co-first authors.
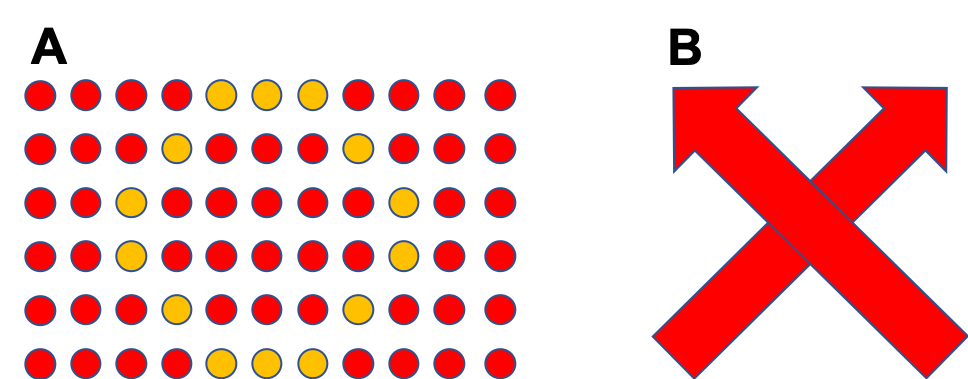
The innate ability of contour integration is a key visual function for humans and animals. The human visual system efficiently extracts local elements from cluttered backgrounds and integrates these elements into meaningful contour perception (Figure 1). This process is a critical step before object recognition, in which contours often play an important role in defining the shapes and borders of the to-be-recognized objects. In a natural environment, due to occlusions, continuous contours and intact objects are often projected onto the retina as isolated elements. Failure to recognize them not only affects visual perception but also poses threats to individual survival. People are not equally well equipped with the contour integration ability. Particularly, some psychiatric disorders, especially schizophrenia, are accompanied with abnormal contour integration ability. Therefore, contour integration is an important visual function whose deficit affects normal life and is relevant to schizophrenia. However, the source of individual differences in this visual function and its molecular mechanisms are largely unknown.

Figure 1. Examples for contour integration. (A) The yellow dots form a continuous curve at the perceptual level due to their similarity in color. (B) The rightwards arrow is perceived as a complete arrow despite the occlusion due to the leftwards arrow.
The current study investigated the genetic basis of contour integration in humans. A total of 2619 normal participants were tested on their ability to detect continuous contours embedded in a cluttered background (Figure 2A, B). Quantitative genomic analysis was performed, involving heritability estimation based on single nucleotide polymorphisms (SNPs) and association testing at SNP and gene levels. Heritability estimation showed that common SNPs contributed 49.5% (standard error of the mean = 15.6%) of overall phenotypic variation, indicating moderate heritability of contour integration. Two-stage genome-wide association analysis (GWAS) detected four SNPs reaching genome-wide significance in the discovery test (N = 1931) but not passing the replication test (N = 688) (Figure 2C). Gene-level analysis further revealed a significant genome-wide association of a microRNA encoding gene MIR1178 in both the discovery and replication cohorts. Another gene poly(A) binding protein nuclear 1 like, cytoplasmic (PABPN1L) showed suggestive significance in the discovery cohort (p < 1×10⁻⁴) and was replicated in the replication cohort (p = 0.009). Remarkably, gene MIR1178 has been found to be related to perceptual rivalry (Chen et al., 2018) and emotion detection ability by the same research group, suggesting its important role in visual perception. Taken together, this study identified significant gene associations with contour integration and provided support for a genetic transmission of the ability to perceive continuous contours in the environment.

(A) Examples of two contour stimuli (within the circular area) used in the behavioral test. Visual contours were formed by collinear line segments embedded in a background of randomly oriented lines. Within the same background, perceptual saliency of contours varies with the number of collinear lines (e.g., four in the left and eight in the right figure). (B) The psychophysical test procedure for contour integration ability measurement. Participants judged the orientation (i.e. left or right) of the contour, which was tilted 45 degrees to the left or right from the vertical direction. (C) Manhattan plots of GWAS results at the discovery stage. GWAS results [-log10(p-value)] are shown in chromosomal order for individually genotyped SNPs that were tested for linear regression with contour integration performance. Each dot represents one SNP. The red dotted line indicates the genome-wide significance level (5×10⁻⁸). Genome-wide significant SNPs are shown as enlarged red dots.
The Fang and Rao laboratories cooperated in exploring the genetic basis of human visual cognition using genomic research methods. This is their second collaborative paper, combining expertise in genetic analyses of Rao lab with that in visual cognition research of Fang lab. This study was supported by the National Natural Scientific Foundation of China (NNSFC), the Ministry of Science and Technology of China (MOST), Beijing Municipal Science and Technology Commission (BMSTC) and the Peking-Tsinghua Center of Life Sciences (CLS). Chongqing Medical University participated in this collaborative project.
References
Chen, B., Zhu, Z., Na, R., Fang, W., Zhang, W., Zhou, Q., … Rao, Y. (2018). Genomic Analyses of Visual Cognition: Perceptual Rivalry and Top-Down Control. The Journal of Neuroscience, 38(45), 9668–9678. https://doi.org/10.1523/JNEUROSCI.1970-17.2018
Zhu, Z., Chen, B., Na, R., Fang, W., Zhang, W., Zhou, Q., … Fang, F. (2019). Heritability of human visual contour integration—an integrated genomic study. European Journal of Human Genetics. https://doi.org/10.1038/s41431-019-0478-2


